.JPG)

What are KPIs? Definition
KPIs, or Key Performance Indicators, are measurable values that organizations use to assess their progress toward achieving specific goals and objectives. KPIs provide a way to track and evaluate performance in various areas of an organization, such as sales, marketing, finance, customer service, and operations. They serve as quantifiable metrics that help businesses understand how well they are performing and whether they are on track to meet their targets.
The most common agency KPIs
Whether you represent some marketing agencies or other companies specializing in project management, you must monitor your agency's performance. Here are some indicators that can help you measure progress of your business using actionable data.
Utilization rate
Utilization rate refers to the measure of how efficiently a resource, such as equipment, personnel, or facilities, is being used within a given time period. It quantifies the extent to which a resource is being utilized relative to its maximum capacity or availability. In service companies, it refers to the time your employees are assigned to the project compared to the maximum time they can work.
Utilization rate formula
The utilization rate can be calculated using the following formula:
Utilization Rate = (Actual Usage / Maximum Capacity) * 100
En esta fórmula:
- Actual Usage refers to the amount of time or quantity the resource is actively utilized or occupied during the specified period.
- Maximum Capacity represents the total available time or quantity the resource could have been utilized during the same period.
The result is expressed as a percentage, indicating the proportion of the resource's capacity that is being utilized.
Importantly, the utilization rate is rarely calculated manually; in the tools such as Primetric, you can see the overview of utilization in your company in a comprehensive report.

However, if you want to learn more about how utilization rate can affect your project or marketing team, visit our article on managing billable utilization.
Resource capacity
Resource capacity represents the maximum amount of a particular resource, such as personnel, equipment, or facilities, that is available for use within a defined period. The formula for calculating resource capacity varies based on the specific resource being considered.
Resource capacity formula
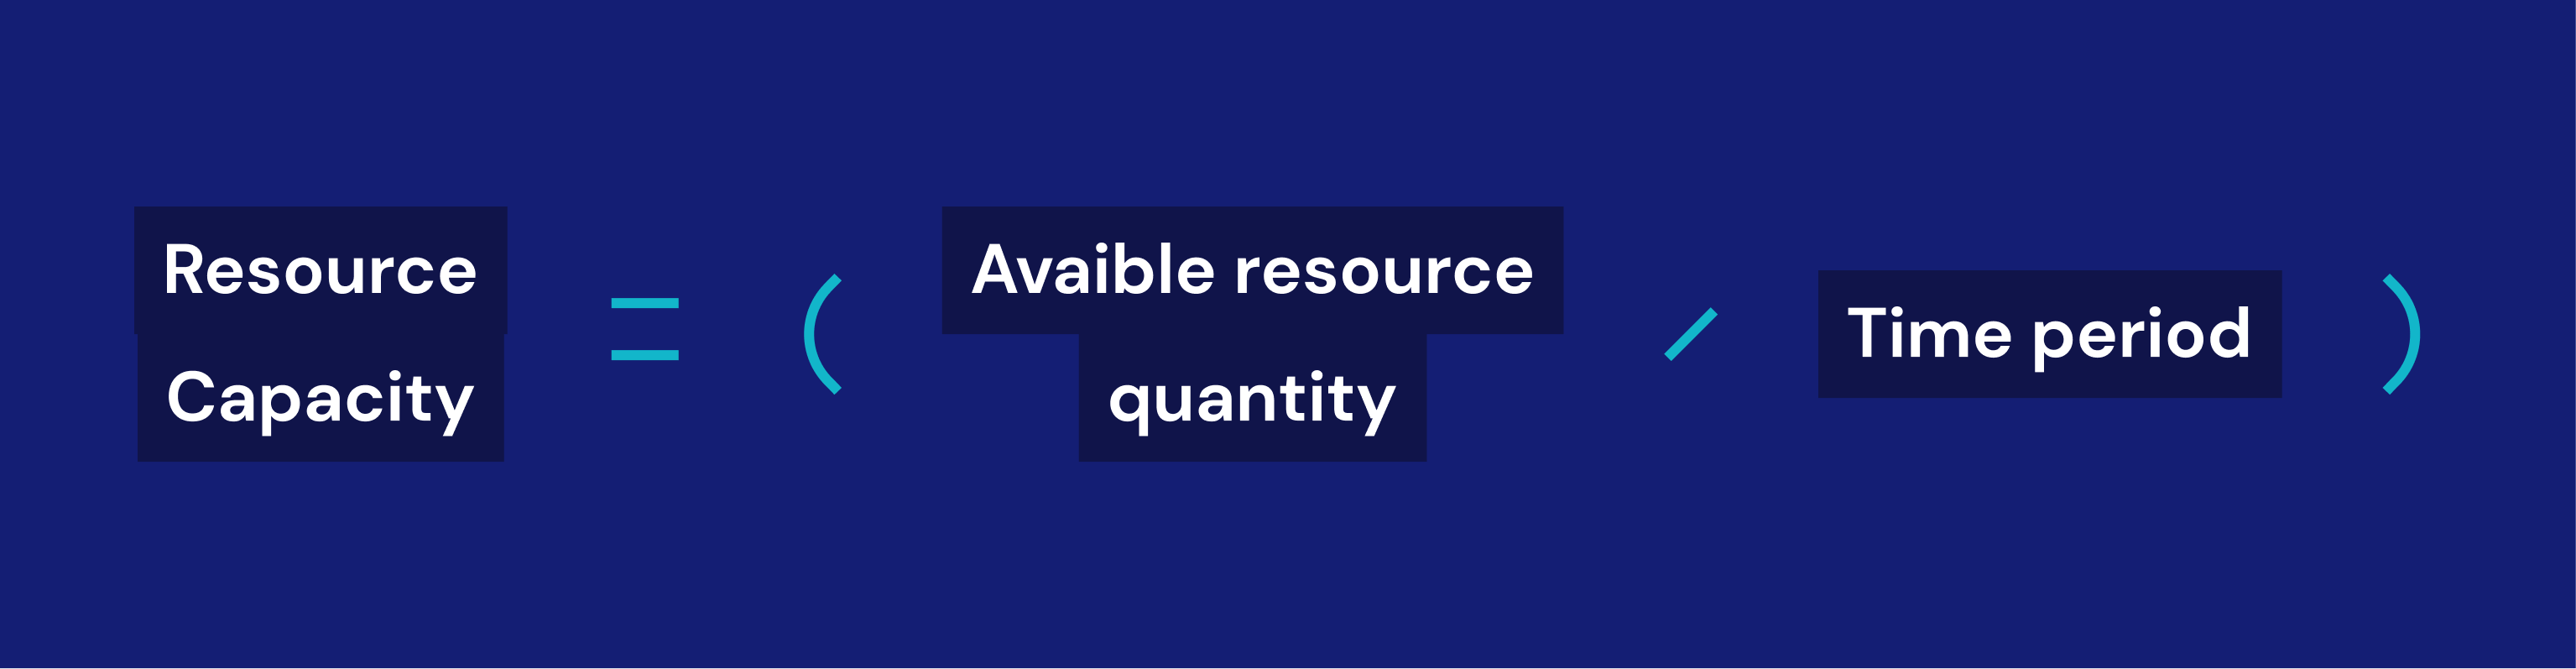
For instance, if a company has 50 employees available for work in a month, the monthly personnel capacity would be 50 employees/month.
Naturally, you can also use other units to calculate capacity - you can find more examples of such calculations in our article about capacity planning.
Profit margins or project profit margins
Profit margin refers to the financial metric that indicates the profitability of a business or a specific product/service. It measures the percentage of revenue that remains as profit after deducting all expenses associated with the production, operation, and sale of goods or services.
The formula for calculating profit margin is as follows:

The result is expressed as a percentage, reflecting the proportion of revenue that translates into profit.
Project profit margin, on the other hand, refers to the expected or projected profit margin for a specific project or initiative. It estimates the profitability of a project before its actual completion by forecasting its revenue and expenses.
The formula for calculating project profit margin is similar to the regular profit margin formula:

However, using actual project costs and actual company costs instead of the estimated cost in these calculations is the key to these calculations. That's because additional costs, such as company overheads (i.e., marketing campaigns, bills, rent, support departments, etc.), can interfere with net margin, making both the project and, in some cases, the company unprofitable.
We delved into the details of such calculations in our e-book - download it now!
Customer acquisition cost (CAC)
Customer Acquisition Cost (CAC) is the total cost incurred by a business or organization to acquire a new customer. It represents the expenses associated with marketing, advertising, sales efforts, and other activities to attract and convert prospects into paying customers.
Customer acquisition cost formula
While there isn't a single universal formula for calculating CAC that applies to all businesses, a commonly used formula is:

Importantly, customer acquisition cost can act as a measure of the success of marketing agencies. When this cost is too high, it might indicate that the marketing efforts and sales process are not suited to customers' needs, causing additional costs and interfering with the company's cash flow.
Actual project time vs estimates
In marketing agencies and IT companies, some projects tend to last more than expected, prolonging the customer's lifetime and, in the case of fixed-price projects, causing additional costs. However, when the actual project duration always exceeds project managers' expectations, you might want to step in and stop your company from losing money.
The simplest way to spot such an issue is to use dedicated project portfolio management tools to generate a report comparing estimates to actuals. For example, in Primetric you can see both the expected project time and actual project time, its costs, and its schedule variance in real-time - as shown in the picture below.

Qualified leads
Qualified leads are potential customers or prospects more likely to convert into paying customers based on specific criteria or attributes. These leads have shown a genuine interest in a product or service and are more likely to engage in further interactions and eventually make a purchase.
The interpretation of such marketing agency KPIs is simple - the more qualified leads the company has, the better the marketing spends its money. However, when the number of qualified leads suddenly drops, your company might be at risk of becoming unprofitable in the future - and that's when you might want to step in and start some new marketing campaigns
Number of new customers
Just like in the example above, the number of new customers is the simplest yet one of the most effective KPIs any agency can have. The more orders you attract, the better - however, many new acquisitions may signal the need to hire new specialists and focus the marketing efforts on recruitment for a while.
Churn rate
The churn rate is basically the opposite of the number of new customers. It is the percentage or rate at which customers or subscribers discontinue their relationship with a company or stop using its products or services within a specific period. It measures customer attrition or the loss of customers over time.
The churn rate is commonly used as a key metric to assess customer retention and loyalty. A high churn rate indicates that many customers are leaving, which can be costly for a business as it impacts revenue, profitability, and long-term sustainability. The reasons for that might differ: from a drop in customer satisfaction to problems with digital marketing to a sudden shift in the market.
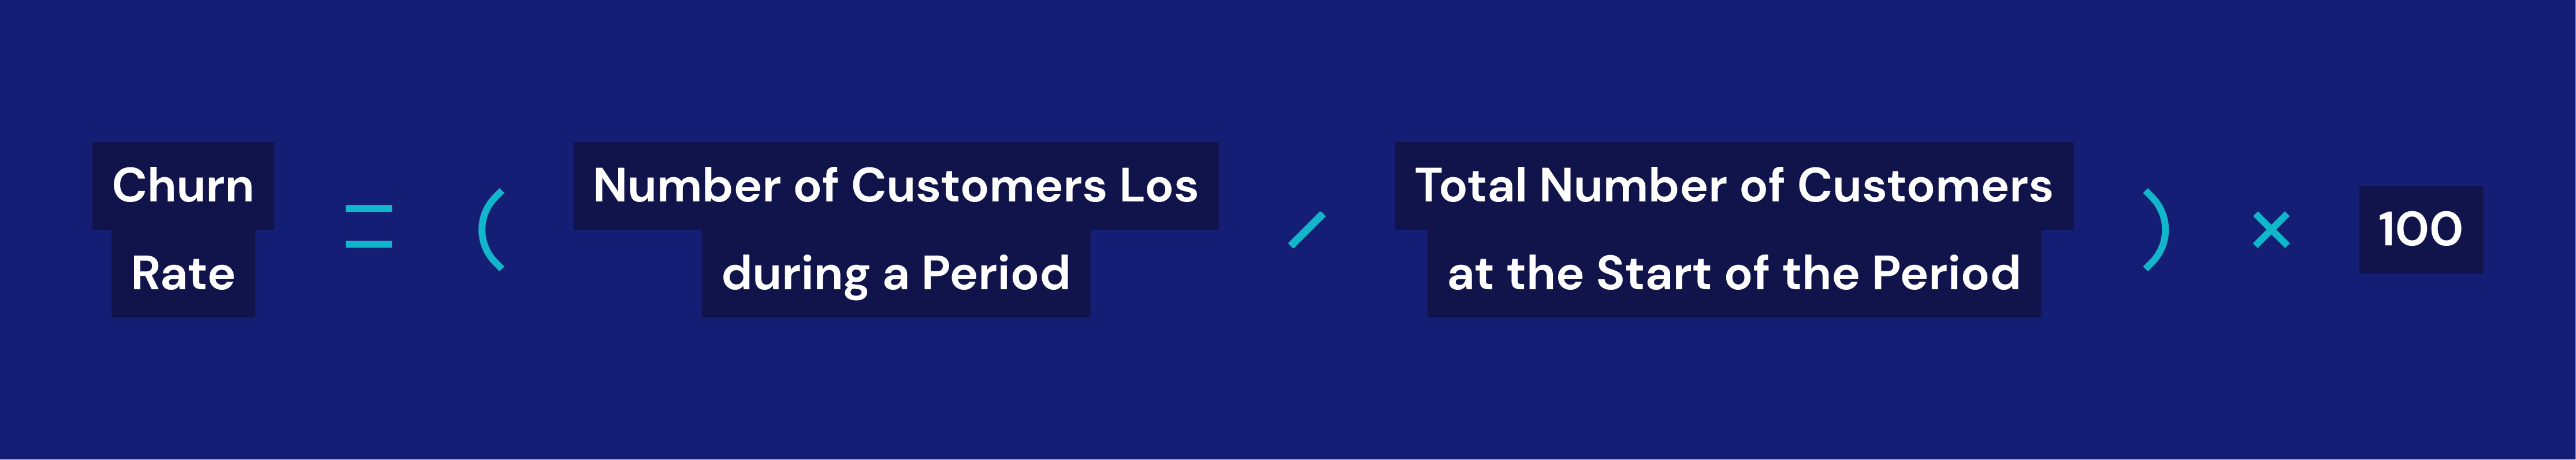
Churn rate formula
To calculate the churn rate, you can use the following formula:
Monthly recurring revenue
Monthly Recurring Revenue (MRR) represents the total revenue a business can expect to receive from its subscription customers each month.
MRR is a critical metric for subscription-based businesses as it provides a clear picture of the company's ongoing revenue stream and the stability of its customer base. By tracking MRR, businesses can assess their financial health, measure growth, and make informed decisions regarding pricing, customer acquisition, and retention strategies.
MRR can be calculated by summing up the monthly subscription fees or recurring charges from all active customers. It excludes one-time or non-recurring revenue sources such as setup fees or one-time purchases. If the pricing structure varies for different subscription tiers or plans, the MRR calculation should account for the specific recurring revenue associated with each plan. In a similar manner, you can also calculate monthly recurring profit.
Sales closing ratio
This is a critical KPI for your sales team. Also known as a win rate or conversion rate, the sales closing ratio refers to the percentage of sales opportunities or leads that a salesperson or sales team successfully converts into closed deals or sales. It measures the effectiveness and efficiency of the sales process in terms of closing deals and converting prospects into customers.
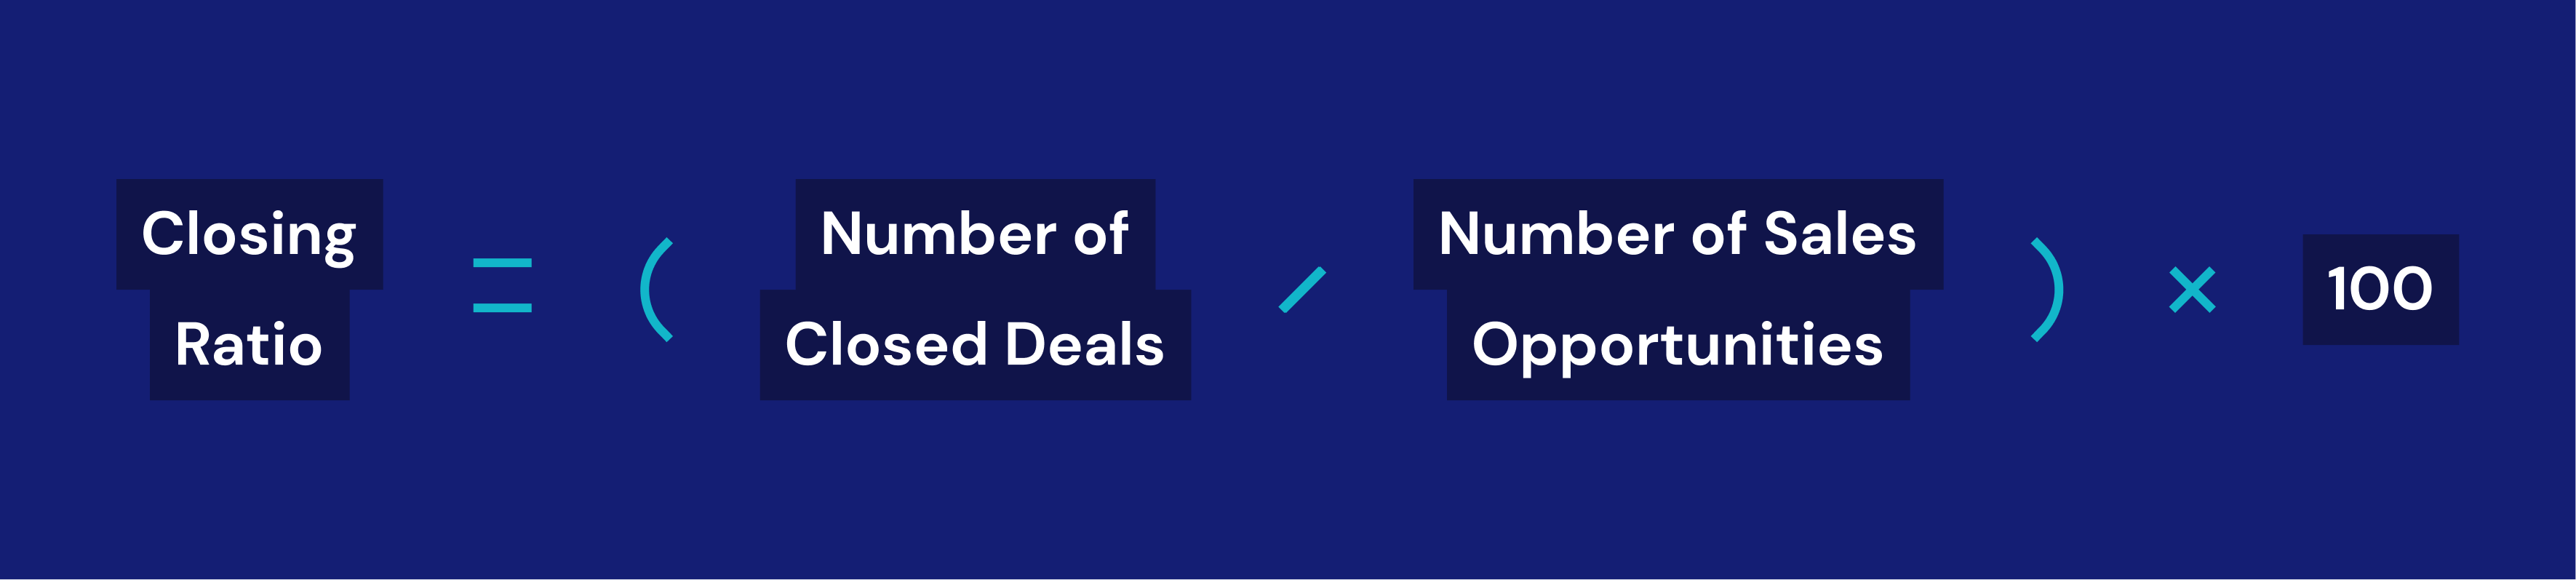
Sales closing ratio formula
The sales closing ratio is calculated using the following formula:
Customer lifetime
Customer lifetime refers to the duration of time that a customer continues to engage and transact with a business or brand. It represents the length of the customer's entire relationship with the company, from their first interaction or purchase to their final transaction or disengagement.
Customer lifetime can simply be calculated by measuring the duration of customer relationships and finding the average time value for all the transactions. The longer the relationship, the better for you - it means that your operating cash flow will remain consistent regardless of the number of sales-qualified leads.
Customer lifetime value
Customer Lifetime Value (CLV) is a metric that represents the estimated total value or revenue that a customer will generate for a business throughout their entire relationship with the company. It quantifies the long-term financial worth of a customer to a business by considering their purchasing patterns, average transaction value, and the duration of their engagement.
CLV is an essential business metric as it helps understand the profitability and economic value of acquiring and retaining customers. By analyzing CLV, companies can make data-driven decisions regarding customer acquisition costs, marketing strategies, and customer relationship management to maximize the return on investment (ROI) and optimize business growth.
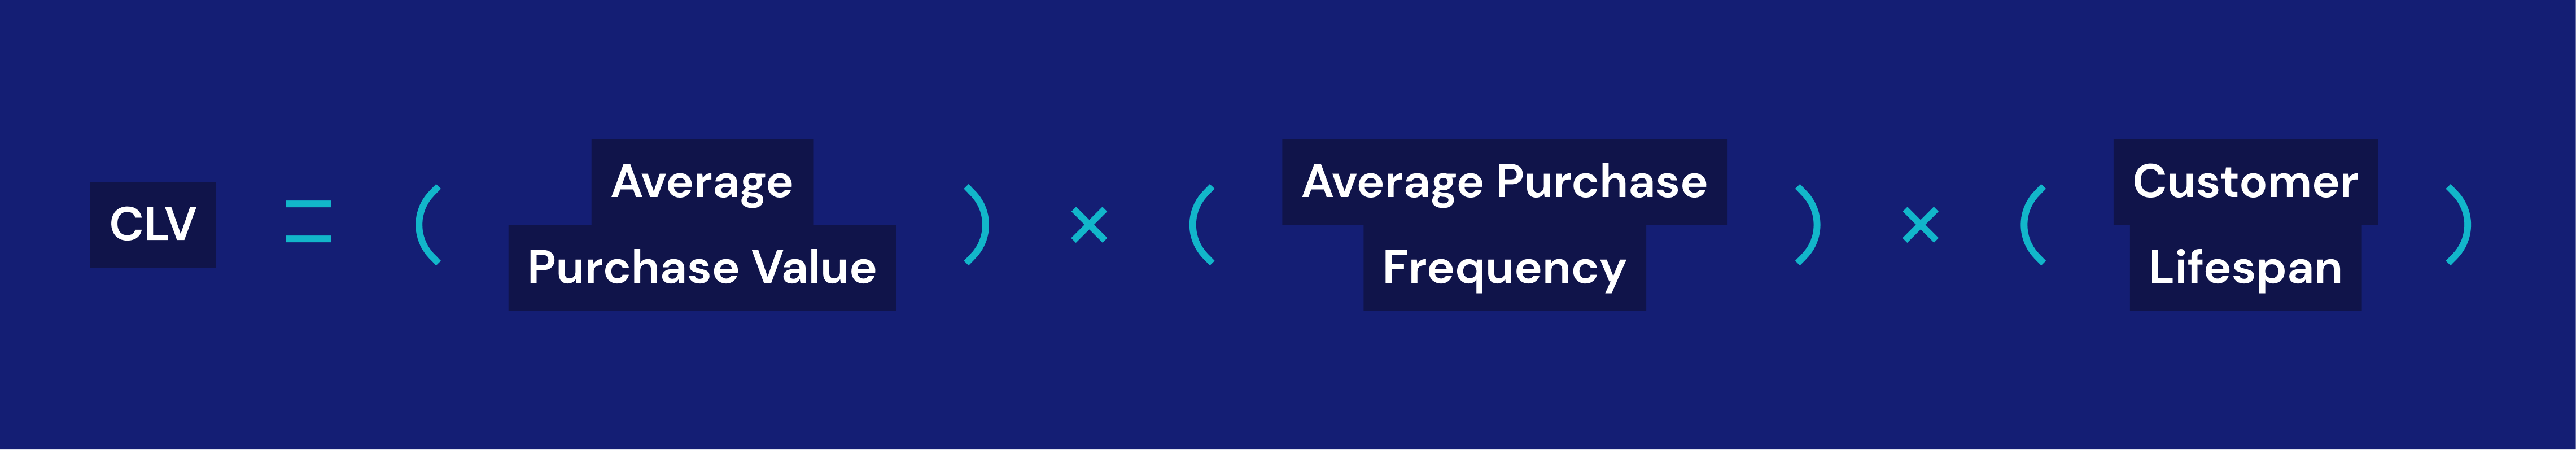
Customer lifetime value formula
CLV can be calculated using various methods, but a commonly used formula is:
Lifetime customer costs
Lifetime customer costs, also known as customer lifetime costs or customer acquisition costs (CAC), refer to the total expenses incurred by a business throughout the entire relationship with a customer. It represents the cumulative costs associated with acquiring, serving, and retaining customers over their lifetime with the company.
Naturally, you need to ensure your lifetime customer cost is as low as possible to generate profits. However, do not take that assumption to an extreme, as lowering the costs might impact the quality of your services and, as a result, customer satisfaction.
Marketing KPIs
Depending on your business type, you might want to measure the results of your marketing strategy or marketing campaign daily. To do that, you will need Google Analytics and some knowledge about basic marketing performance indicators and marketing channels, such as:
- monthly website traffic - or the total number of visits or interactions that a website receives within a specific calendar month,
- organic traffic - or the traffic acquired from the search engines, often using SEO strategy,
- the results from paid ads (or conversion rates),
- follower count,
or any other results from tools your company uses - these are just a few examples.
I want to learn more about business performance!
Great - we have a few resources you will definitely find useful.
Visit our blog and read about:
- a perfect process improvement plan,
- measuring business performance in your company,
- project forecasting software you can use for your analysis,
- an overhead absorption rate,
- revenue projection.
Alternatively, if you want a tool that's capable of calculating all of these metrics - and many more - simply book a demo with our advisors and try Primetric now!


